Pottinger
  • Home
    • Contact Pottinger
    • 简体中文
    • Legal notices
    • Careers >
      • Graduates and Interns
  • Why Pottinger?
  • How we work
  • Our services
    • Companies & Governments
    • Startups
  • Senior team
    • Cassandra Kelly
    • Nigel Lake
    • John Sheehy
    • Andrew Paddon
    • Rodrigo Arias
    • Gerry Grove-White
    • Andrew Agnew
    • Maria Atkinson AM
    • Nicholas Gold
    • Maureen Papas
    • Michael Sullivan
    • Tony Eyres
  • Perspectives
    • Covid
    • Future of Society
    • Previews
    • Manifesto
    • Institute
  • SBR

COVID-19 resources

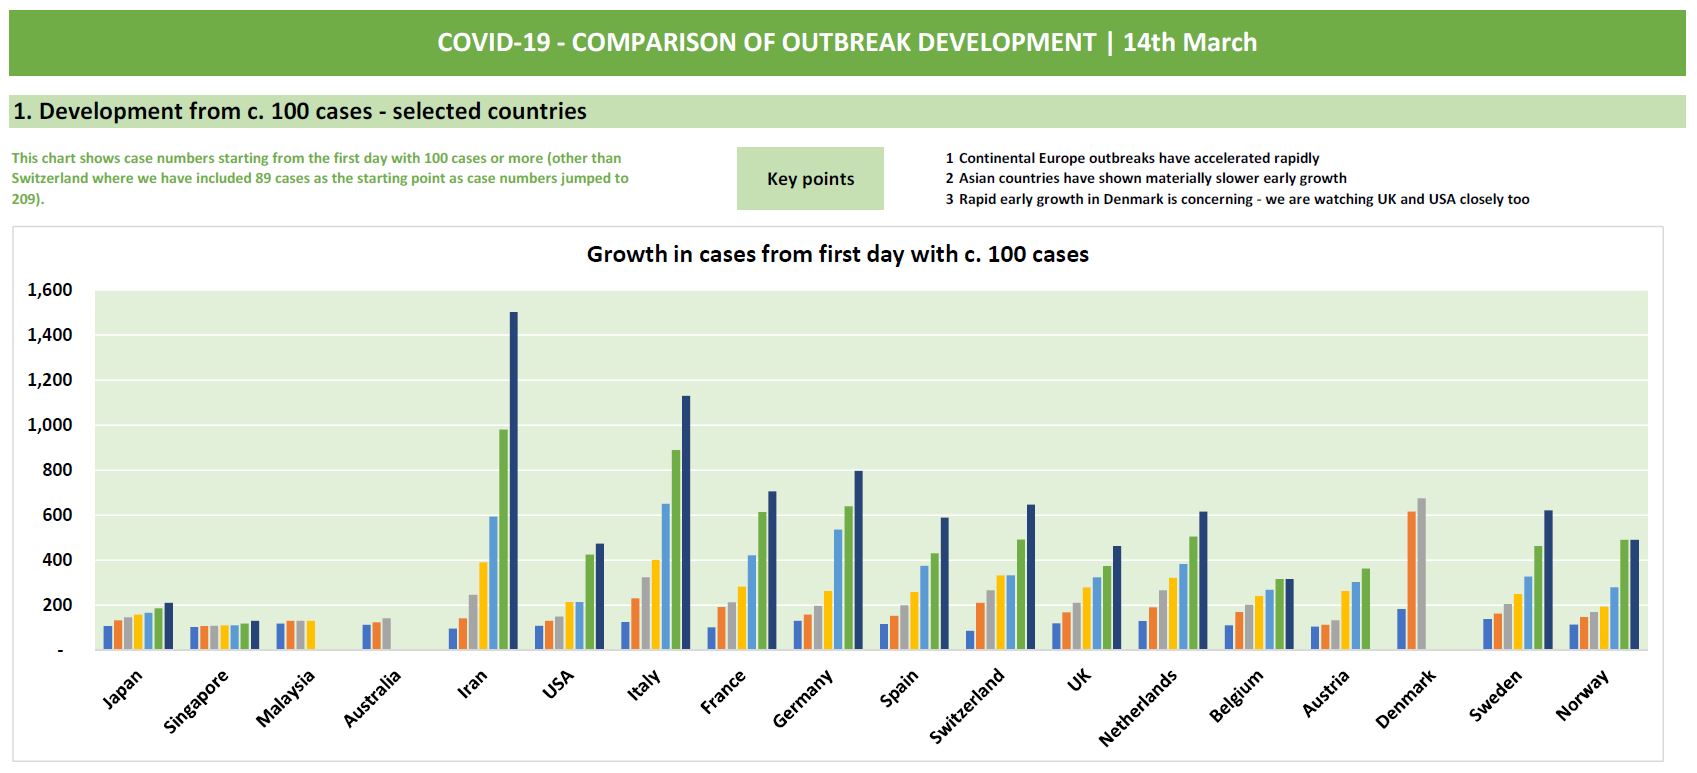
Comparison of outbreak development - 14th March

14/3/2020

 
The chart below shows how the outbreak has developed in various countries, starting from the first day with 100 or more cases.  Click the image for further detail including a longer time series.  
Picture
​

Comments are closed.

    Categories

    All
    Articles
    Australia
    Global Summary
    Outbreak Development
    Policy
    Quick Update
    Toolkit
    Video Discussions

    Subscribe

    Free resources to support you and your team as we work together to mitigate the impact of corona virus - please feel free to share!

    Johns Hopkins dashboard
    WHO Covid data
© COPYRIGHT 2016, 2017, 2018. ALL RIGHTS RESERVED.
​Legal notices
Contact us
  • Home
    • Contact Pottinger
    • 简体中文
    • Legal notices
    • Careers >
      • Graduates and Interns
  • Why Pottinger?
  • How we work
  • Our services
    • Companies & Governments
    • Startups
  • Senior team
    • Cassandra Kelly
    • Nigel Lake
    • John Sheehy
    • Andrew Paddon
    • Rodrigo Arias
    • Gerry Grove-White
    • Andrew Agnew
    • Maria Atkinson AM
    • Nicholas Gold
    • Maureen Papas
    • Michael Sullivan
    • Tony Eyres
  • Perspectives
    • Covid
    • Future of Society
    • Previews
    • Manifesto
    • Institute
  • SBR